X bar R Chart PDF
X bar and R chart can help you evaluate the stability of processes using variable data time, cost, length, weight.


 Stats Calculator
| X-bar Chart Constants | For Sigma Estimate | R Chart Constants | S Chart Constants | ||||
|---|---|---|---|---|---|---|---|
| Sample (Size = m) |
A2 | A3 | d2 | D3 | D4 | B3 | B4 |
| 2 | 1.880 | 2.659 | 1.128 | 0 | 3.267 | 0 | 3.267 |
| 3 | 1.023 | 1.954 | 1.693 | 0 | 2.574 | 0 | 2.568 |
| 4 | 0.729 | 1.628 | 2.059 | 0 | 2.282 | 0 | 2.266 |
| 5 | 0.577 | 1.427 | 2.326 | 0 | 2.114 | 0 | 2.089 |
| 6 | 0.483 | 1.287 | 2.534 | 0 | 2.004 | 0.030 | 1.970 |
| 7 | 0.419 | 1.182 | 2.704 | 0.076 | 1.924 | 0.118 | 1.882 |
| 8 | 0.373 | 1.099 | 2.847 | 0.136 | 1.864 | 0.185 | 1.815 |
| 9 | 0.337 | 1.032 | 2.970 | 0.184 | 1.816 | 0.239 | 1.761 |
| 10 | 0.308 | 0.975 | 3.078 | 0.223 | 1.777 | 0.284 | 1.716 |
| 11 | 0.285 | 0.927 | 3.173 | 0.256 | 1.744 | 0.321 | 1.679 |
| 12 | 0.266 | 0.886 | 3.258 | 0.283 | 1.717 | 0.354 | 1.646 |
| 13 | 0.249 | 0.850 | 3.336 | 0.307 | 1.693 | 0.382 | 1.618 |
| 14 | 0.235 | 0.817 | 3.407 | 0.328 | 1.672 | 0.406 | 1.594 |
| 15 | 0.223 | 0.789 | 3.472 | 0.347 | 1.653 | 0.428 | 1.572 |
| 16 | 0.212 | 0.763 | 3.532 | 0.363 | 1.637 | 0.448 | 1.552 |
| 17 | 0.203 | 0.739 | 3.588 | 0.378 | 1.622 | 0.466 | 1.534 |
| 18 | 0.194 | 0.718 | 3.640 | 0.391 | 1.608 | 0.482 | 1.518 |
| 19 | 0.187 | 0.698 | 3.689 | 0.403 | 1.597 | 0.497 | 1.503 |
| 20 | 0.180 | 0.680 | 3.735 | 0.415 | 1.585 | 0.510 | 1.490 |
| 21 | 0.173 | 0.663 | 3.778 | 0.425 | 1.575 | 0.523 | 1.477 |
| 22 | 0.167 | 0.647 | 3.819 | 0.434 | 1.566 | 0.534 | 1.466 |
| 23 | 0.162 | 0.633 | 3.858 | 0.443 | 1.557 | 0.545 | 1.455 |
| 24 | 0.157 | 0.619 | 3.895 | 0.451 | 1.548 | 0.555 | 1.445 |
| 25 | 0.153 | 0.606 | 3.931 | 0.459 | 1.541 | 0.565 | 1.435 |
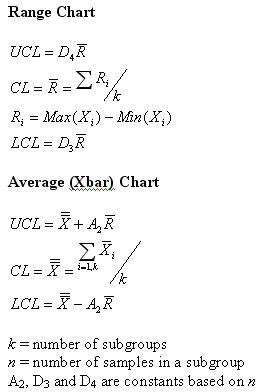
X bar R Chart Formulas
Below are the X bar R chart formula that used in the QI Macros for both Range & Avg(Xbar) charts.
Control chart constants for X-bar, R, S, Individuals (called "X" or "I" charts), and MR (Moving Range) Charts.
Note: To construct the "X" and "MR" charts (these are companions) we compute the Moving Ranges as:
R2 = range of 1st and 2nd observations, R3 = range of 2nd and 3rd observations, R4 = range of 3rd and 4th observations, etc.
sigma(Σ) = (MR-bar)/d2 where the value of d2 is based on, as just stated, m = 2.
Similarly, the UCL and LCL for the MR chart will be: UCL = D4(MR-bar) and LCL = D3(MR-bar)
But, since D3 = 0 when n = 0 (or, more accurately, is "N/A") there will be no LCL for the MR chart, just a UCL.
 Related Statistical Tables ►